Network visualizations
Interactive visualizations of networks, such as mapping the social networks of the political elite.
Suggested resource:
- Map the Power toolkit by LittleSis: "This toolkit has been designed to provide people with the tools to conduct power research and develop a research pod, or crew of folks, that have the skills to investigate local corporate bodies and organize against them."

Disint.ai
disint.ai - a narrative intelligence and social listening platform for YouTube.
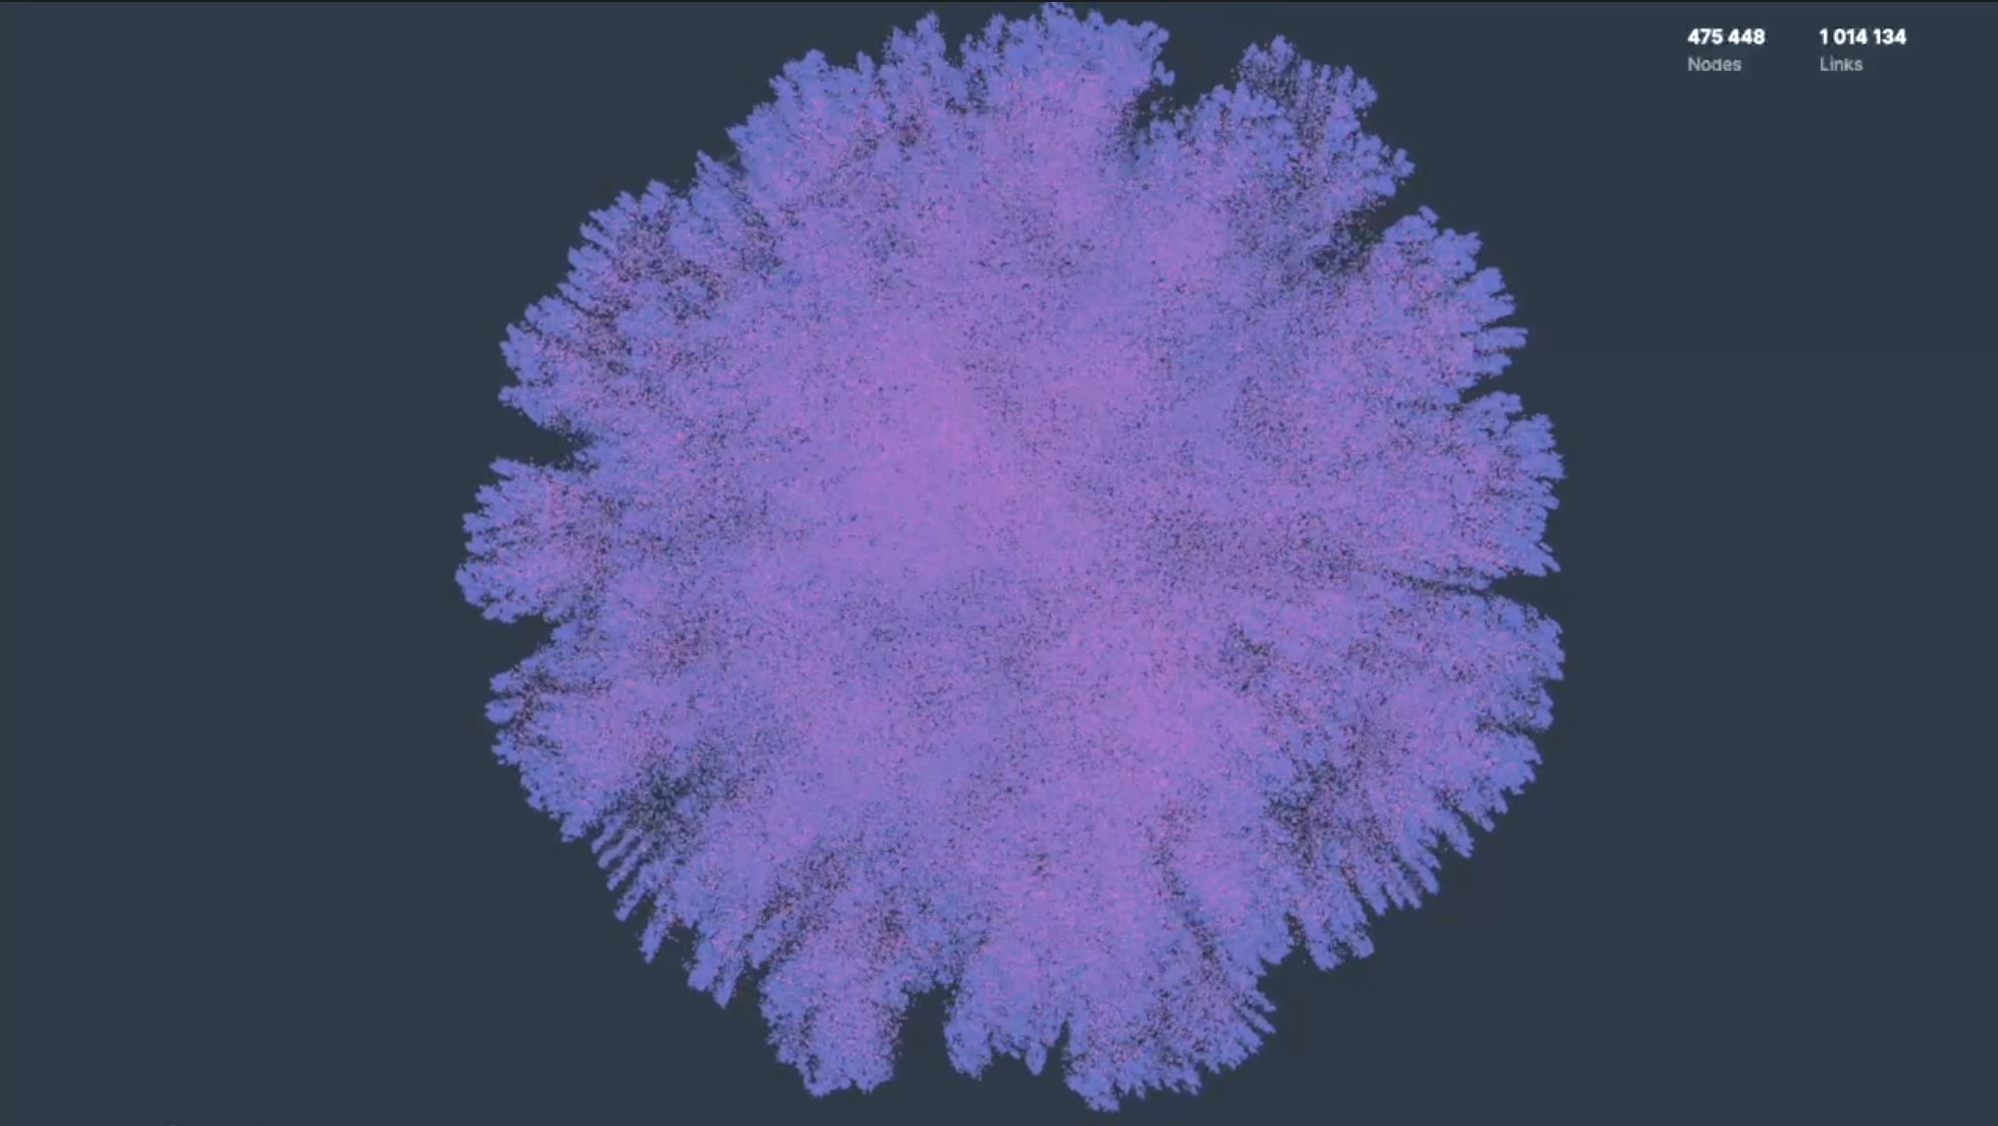
cosmos.gl
a high-performance WebGL library for visualizing network graphs and machine learning embeddings.

The Authoritarian Stack
This project maps the "Authoritarian Stack"—a network of firms, funds, and political actors turning core state functions into private platforms.

Lex-graph
Building a knowledge graph of UK legislation

Capitol Riot Map
Mapping the networks of the 1,580 individuals who were arrested, charged, or convicted for participating on the attack on the U.S. Capitol on January 6, 2021.

Pardon Tracker
An independent investigative journalism and data visualization project, documenting the statements, activities, and networks of the individuals that received pardons or commutations for criminal charg...

Congressional systems map
This map...illustrates a [Congress] in a state of dysfunction, with growing dissatisfaction on the part of the public, waning trust in its ability perform, and -- most significantly -- large-scale dis...

Murmurations
Making movements visible

Merit
The Merit Data Platform connects organizations and people on a flexible HIPAA and SOC2 compliant knowledge graph.

OCCRP Aleph
The global archive of research material for investigative reporting.
Communalytic
Communalytic is a computational social science research tool for studying online communities and discourse.

Netvizz
Netvizz is a data collection and extraction application that allows researchers to export data in standard file formats from different sections of the Facebook social networking service.

Hoaxy
Hoaxy is a tool that visualizes the spread of articles online.

Network Contagion Research Institute
NCRI has built its own proprietary platform that has played a critical role in the identification and forecasting of emerging threats that threaten the Economic, physical and social health of civil so...

PubinTech Project Map
Visualize the public-interest ecosystem of the private, public, academic and independent players that are directly (or indirectly!) collaborating on key public problems.

Doublethink Labs
Doublethink Lab was founded in 2019 to strengthen democracy through enhancing digital defenses. Our work focuses on researching malign Chinese influence operations and disinformation campaigns and the...

An ecosystem of corporate politicians in Portugal
An interactive visualization of the relationships between members of Portuguese governments and companies for the period of 1975 to 2013.

Gephi
Makes graphs handy

Onodo
Every network tells a story

LittleSis
LittleSis is a free database of who-knows-who at the heights of business and government.

Building Maintenance Network Chart
傳真社將逾220個大廈翻新工程的入標資料製作成「樓宇維修工程關係圖」,使用者只需要輸入屋苑、顧問或工程公司名稱,便可以找到相關公司或工程的入標紀錄,有助了解公司口碑。

The Org
Discover the people behind the world’s most innovative companies

Mapping the News and Information Ecosystem
A blog post covering ways to map the media ecosystem