Dashboards
Dashboards present and visualize key data, including trends and hotspots, in a single glance. The most common example in this subgenre are municipal dashboards, which display data indicators across a city for operators or citizens to monitor.
Suggested reading:
Heather Froehlich and Michael Correll question if dashboards are "acting not as aids to decision-making but as devices to be passively consumed or observed: spectacles to “take in” rather than tools to guide action".
Katya Abazajian asks, "When so many data dashboards offer few satisfying answers, we might wonder why local leaders default to building them again, and again, and again. Is it too late to give dashboards a new purpose?"
Govtech: Chief data officers gathering at the Bloomberg CityLab conference in Amsterdam recently looked back on all those data dashboards so quickly built during the height of the COVID-19 pandemic in 2020.
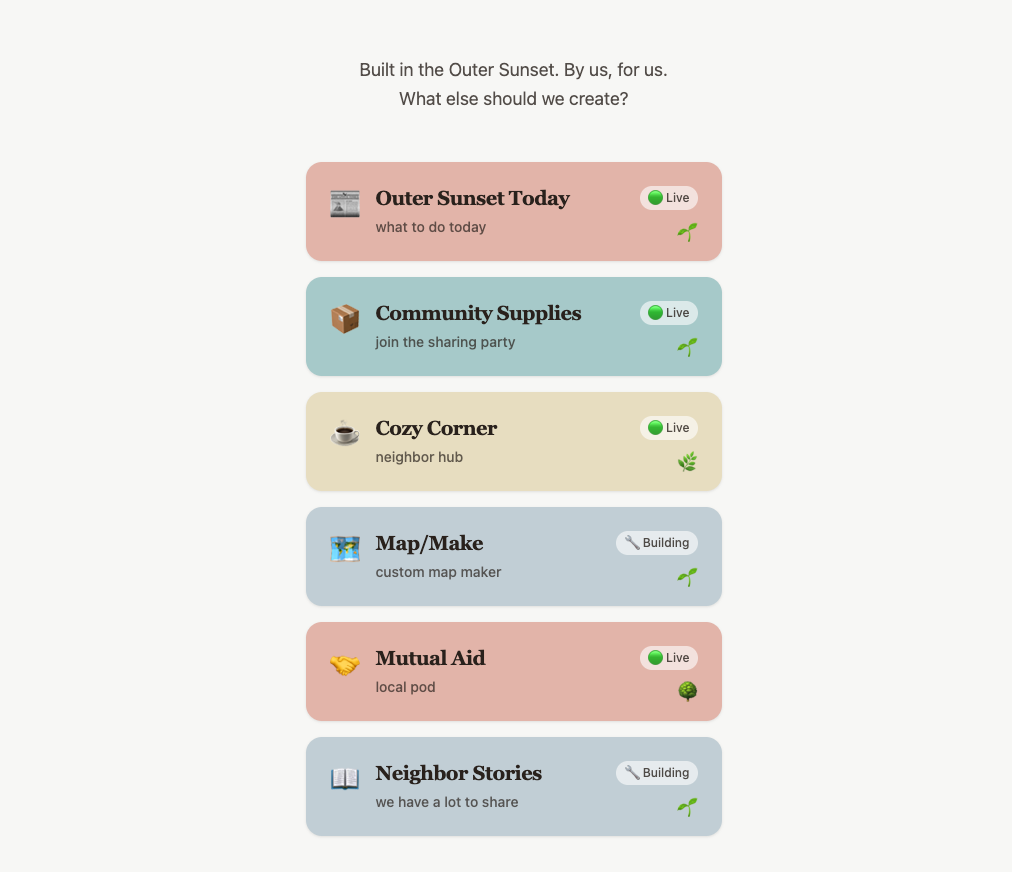
Community Apps Dashboard
A dashboard or directory showcasing community-built digital tools and resources created by and for local residents.

CrossOver
Tracking the role of algorithms on the spread of disinformation

US funding freeze global survey
OCHA carried out two global survey to assess the consequences of the US funding freeze on humanitarian action globally. The first round, in February, looked at the impact of the suspension orders and...

IFRC GO
IFRC GO aims to make all disaster information universally accessible and useful to IFRC responders for better decision making.
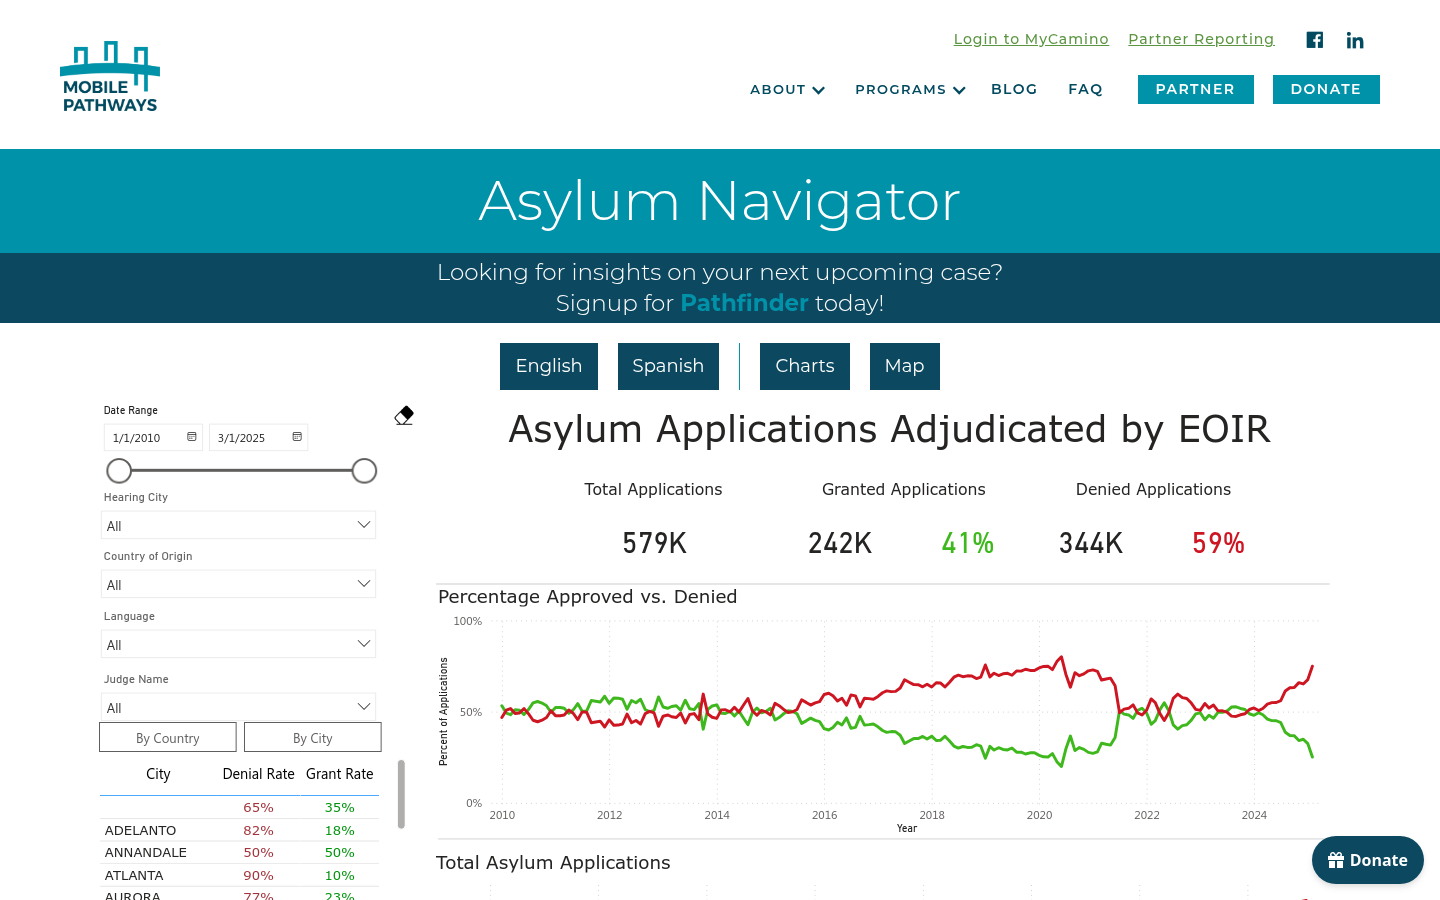
Asylum Navigator
Asylum Navigator is a groundbreaking data insights platform designed to empower immigration attorneys and human rights defenders.

Judge Profiles
Access data on immigration judges, including cases, backlogs, grant rates, and removal statistics
Digital Defense
Digital Defense is a comprehensive resource that provides checklists and guides to help individuals secure their digital lives and protect their privacy across various aspects such as authentication,...

Metabase
Providing an open‑source business intelligence and embedded analytics platform for creating dashboards, querying data, and embedding analytics.

Neighborhood Explorer
Platform for tracking public data metrics for local governments and nonprofits.

CincyInsights
Our goal is to make government data simple to use, easy to understand, and effortless to access. No data or tech knowledge is required.

SAGA Smart Machinaka Project
The SAGA Smart Machinaka Project is a demonstration project that aims to improve the convenience of the city center of Saga City through the use of technologies such as AI and IoT, and to create a cit...

Metroboard
A a mid-century live subway map on Kickstarter

Upward Mobility Data Dashboard
The Upward Mobility Dashboard helps people understand key conditions affecting upward mobility from poverty and racial equity in communities.
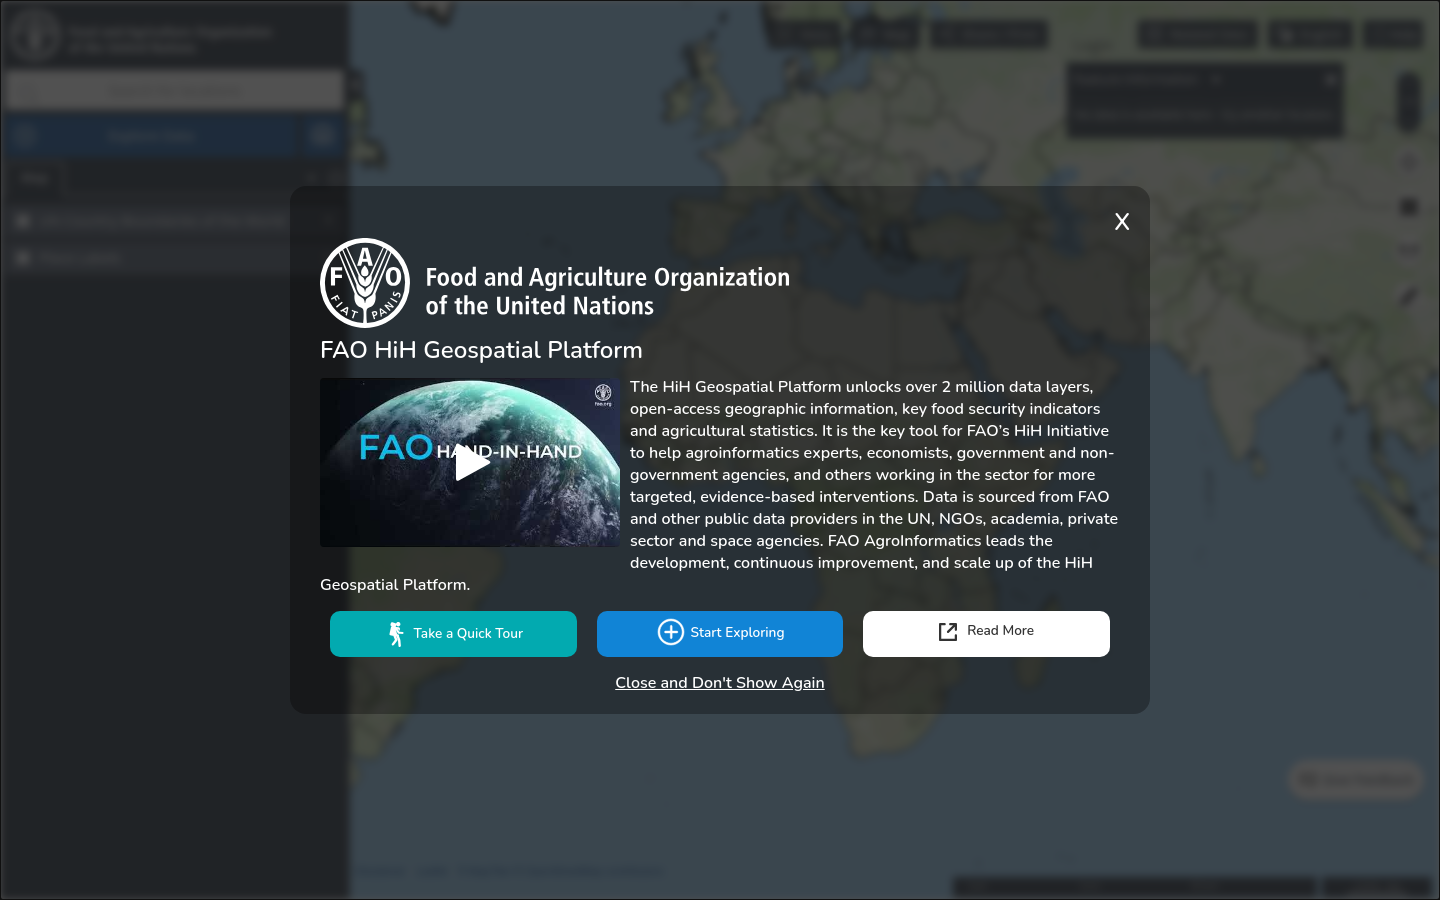
Food and Agriculture Organization Hand-in-Hand Geospatial Platform
The Hand-in-Hand (HiH) Geospatial Platform is the enabling tool for the HiH Initiative unlocking over 2 million data layers for more targeted, evidence-based interventions.
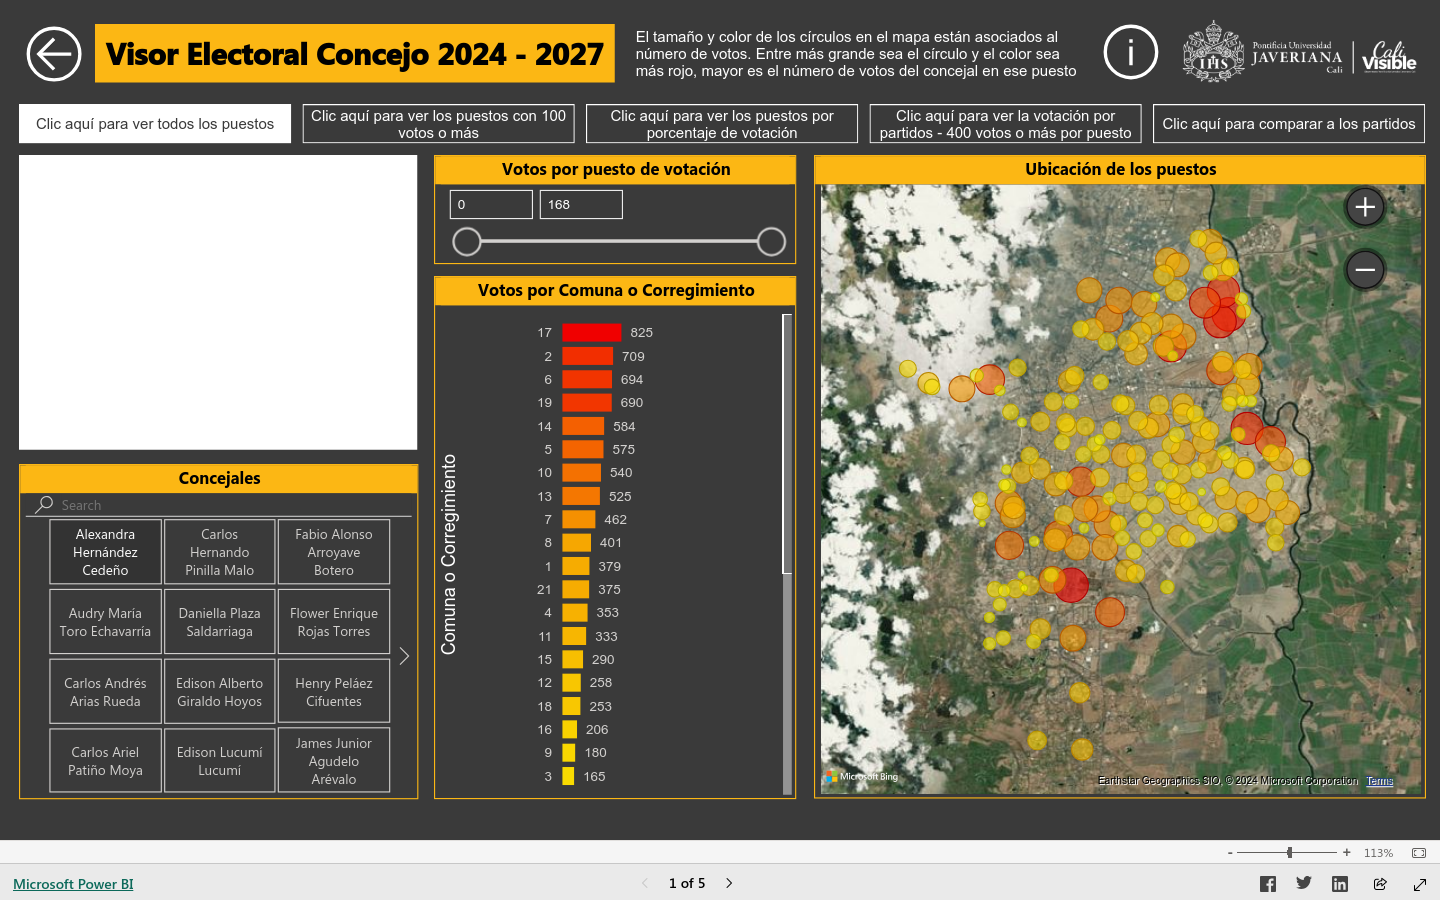
Visor Electroal Concejo 2024 - 2027
Vote map and data dashboard showing support for elected representatives in Cali, Colombia
LookerStudio
Formerly Google Studio. Unlock the power of your data with interactive dashboards and beautiful reports that inspire smarter business decisions. It's easy and free.
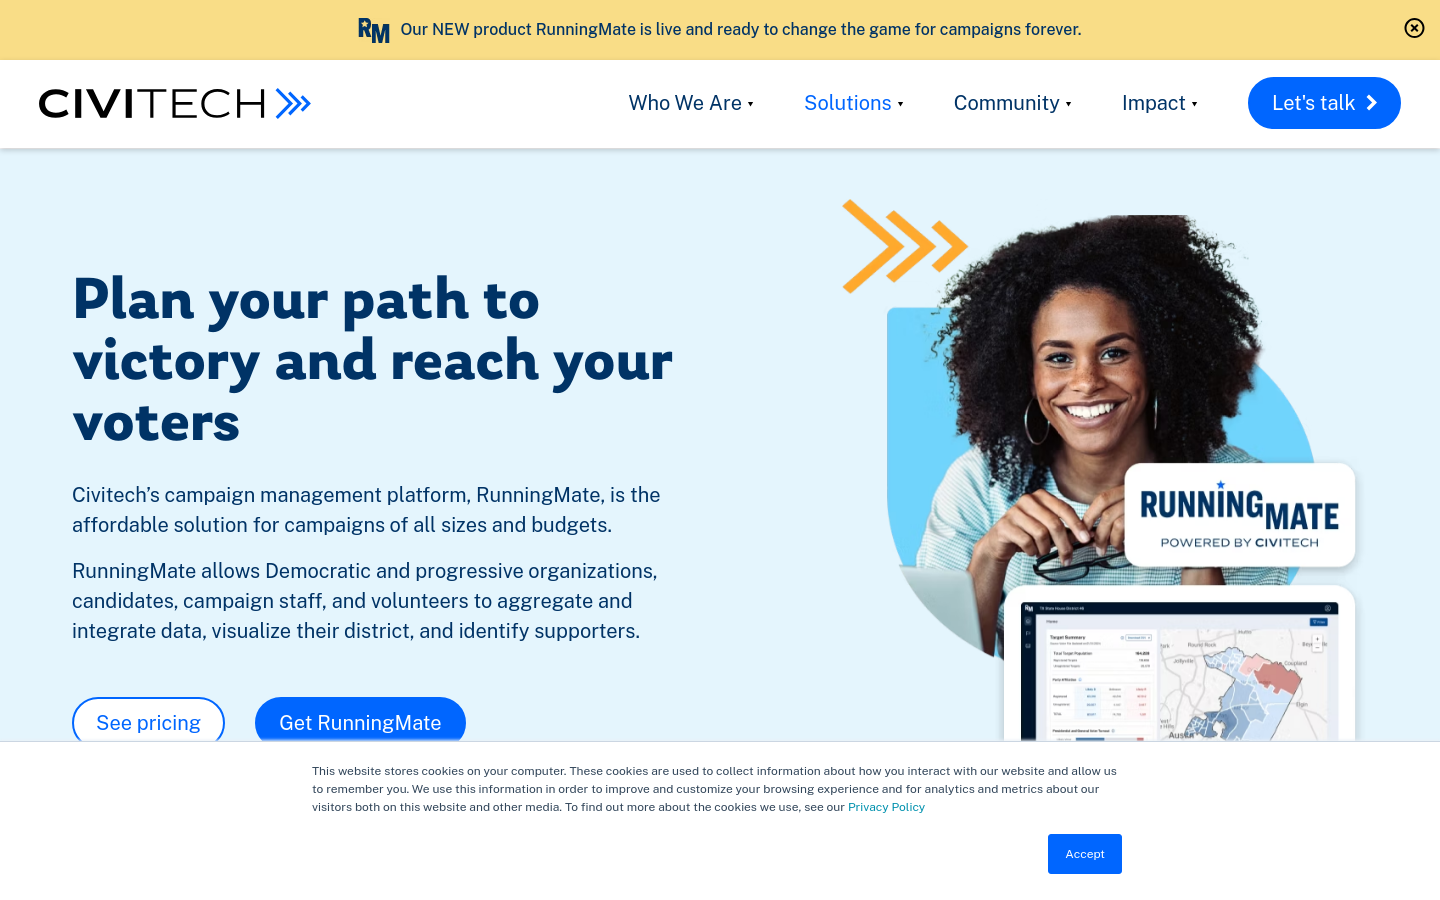
RunningMate
Civitech’s campaign management platform, RunningMate, is the affordable solution for campaigns of all sizes and budgets.

PoliDashboard
An app for tracking political advertisements on Meta-owned advertising platforms such as Facebook and Instagram.

Urban Platform
A web solution designed for governments that provides the digital twin of the city, and delivers a real-time view of every street, plus insightful analytics to support decision-making and increase th...

Colorado Broadband Hub
The Colorado Broadband Office (CBO) leads the statewide effort to expand broadband coverage and quality for all Coloradans and coordinates all broadband efforts for Colorado.

Misinformation Amplification Analysis and Tracking Dashboard
At the Integrity Institute, we are tracking how misinformation performs on platforms to measure the extent to which platforms are amplifying misinformation, and the extent to which they are creating a...

ImpactBoard
ImpactBoard is a data management solution (and dashboard) that provides programmes with intelligence to achieve impact.

The Social Media Dashboard for the German 2021 Federal Election
A live dashboard analyzing the top German candidate's presence on multiple social media platforms.

Hamilton 2.0
The Hamilton 2.0 dashboard, a project of the Alliance for Securing Democracy at the German Marshall Fund of the United States, provides a summary analysis of the narratives and topics promoted by Russ...

Ride Report
From bikes to scooters and everything in between, dockless mobility offers cities a range of new options and challenges. Ride Report is your comprehensive toolset to manage emerging mobility services.

Populus
A PLATFORM FOR CITIES TO MANAGE THE FUTURE OF MOBILITY

Civil Cops
Report Civic & Social Issues through our Artificially Intelligent chat & voice interfaces integrated onto all the major social media channels

OpenGov Open Data
OpenGov’s comprehensive open data and financial transparency solutions help agencies of all sizes drive accountability, make data more useful, engage the public, and unlock economic potential.

Google Trends Coronavirus dashboard
A dedicated dashboard to understand coronavirus searches

Boston CityScore
CityScore is an initiative designed to inform the Mayor and city managers about the overall health of the City at a moment’s notice by aggregating key performance metrics into one number.

BoardStat
Empowers users to discover issues and trends within their district’s boundaries.

WindyGrid
WindyGrid is a computer application, designed for City personnel, that makes Chicago’s big data easily and strategically accessible in one place.

NYC Taxi and Limousine Commission Data Hub
TLC Data Hub offers users a new and convenient location to access and visualize taxi and for hire industry data.

Trimble
With Trimble at your side, you can harness geospatial data collection and measurement technologies, field inspection and asset management tools, as well as analysis systems to engage with citizens, co...

UK official statistics on homelessness: comparisons, processes and definitions
This tool will help you to compare official statistics on homelessness and rough sleeping across the UK, with information provided on each of the four countries.

Brookings Democracy Dashboard
The Brookings Democracy Dashboard is a collection of data designed to help users evaluate political system and governmental performance in the United States.

Displacement Alert Portal
DAP Portal is a comprehensive new research tool that includes dozens of datasets indicating harassment and potential displacement from New York City housing.

SeeClickFix Report Card
Using 311 Data to Drive Change and Manage Performance

GOV.UK Performance Dashboards
If you’re a government service manager, you can see how your service is doing by using a Performance Dashboard. A dashboard lets you quickly spot problems with your service so you can take action to i...